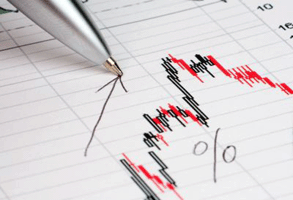
The market itself can indicate how a stock will fare in the coming months. Looking at the overall direction of the market will tell you about future trends. Most, if not all, stocks move with the market. If the stock market is experience a period of growth (a bull market) most stocks will steadily grow. If the stock market is in a decline (a bear market) most stocks will slowly lose value. There may be one day bumps here and there but the general trend will follow the flow of the market at large. To determine the direction of the market only two pieces of information are needed; price and volume. Price refers to the trend of prices of stocks. Volume refers to the amount of stocks being traded. When these two figures are put together it reveals whether there are more sellers in the market or there are more buyers.
To determine price, day traders and investors use various indicators of technical analysis: Simple Moving Average (SMA) or Exponential Moving Average (EMA), Relative Strength Index (RSI), Moving Average Convergence/Divergence (MACD), Bollinger Bands. These indicators help traders and investors determine whether the market is going to continue in the current trend or reverse course.
To determine volume, traders and investors look to the daily sales volume of the markets. The daily sales volume is easily obtained from several websites online.
If the stock has experienced a high-volume day and prices are up then the stock is up. When these conditions exist larger investors, such as institutional investors and mutual funds, will buy more and will boost the market further upwards. Conversely, if the stock had a high-volume day but prices are down. It is a sign of the bigger investors backing out of the stock and can be a sign of a downward turn.
However, a high-volume, low-price day does not necessarily mean a turn for the worse. Often times if there are several days in a row with high-volume and high prices, there will be a day where the volume remains the same and the prices decrease. This trend is referred to as "profit taking" and is a result of investors taking the profits they built up in the last few days.
If there is a continual presence of down days in the market, it could be a sign of a stall or a reversal of course. Institutional investors and mutual funds buy and sell in large volume which means they have the power to move the market. When they begin moving in a direction, the rest of the market follows.
Investing in stocks requires a lot of efforts and hard work. However, if you don`t want to monitor the market for hours every day and analyze specific stocks for trends and volume you would probably be interested in some services which provide all necessary analytical information and reports. One of them, Technical Stock Screener service provides reports that will help traders to find Trending Stocks as well as stocks which reached New High and Lows recently. For trends confirmation there are Volume Trends or Rising On Unusual Volume reports. Such information will help traders and investors find best investment opportunities on the market.
A lot of traders and investors are persuaded that decision to invest in specific stock should be reasoned by trend signals showing by the stock. They buy if they see the stock is in trend and prefer to stay away if it does not.


Add your Comment
or use your BestCashCow account